Chrome DevTools MCP with OpenCode.
Hello developer 👋 Have you ever had a web page with a button that does not work and you do not know why? In this post we try Chrome DevTools MCP, an open source project that gives AI agents access to Chrome DevTools. We configure it in OpenCode and apply it to a real debugging case: a cart button that does not respond.
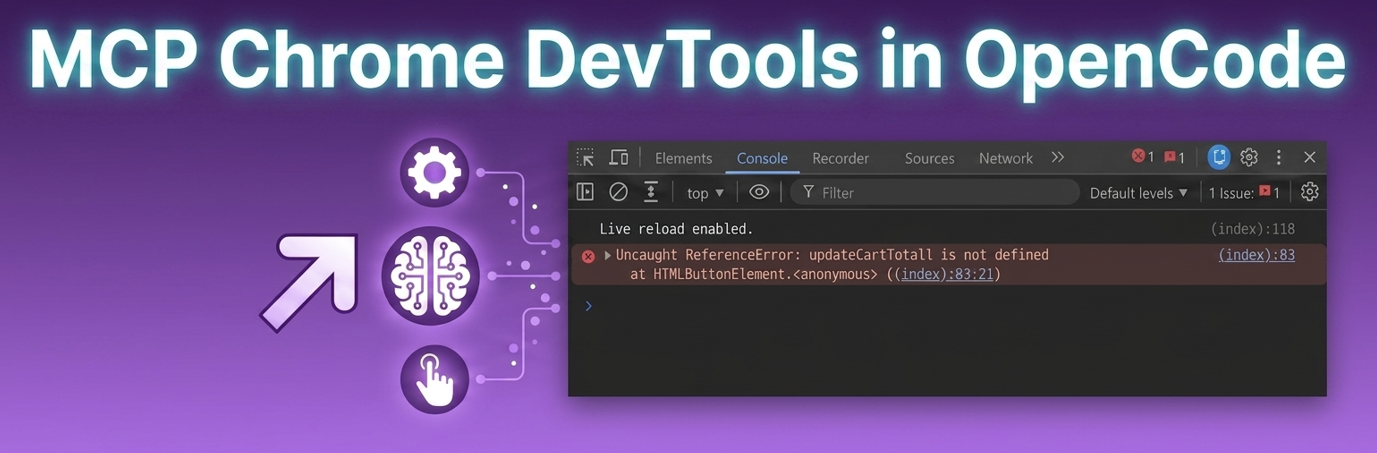
What is Chrome DevTools MCP
Chrome DevTools MCP lets your AI agent drive a real Chrome browser. The key difference: the AI does not guess the code. It opens Chrome, clicks the button, reads the console, and finds the error. And it does not stop there: it fixes the bug and tests the button again to confirm everything works.
The example
The example is a web page with a cart button that does not work. Instead of looking at the code blindly, we let the AI use a real Chrome browser to find the problem.
Looking at index.html, we see the bug: it is a typo. The call should be updateCartTotal(), not updateCartTotall(cartTotal).
We open index.html with pnpm dlx live-server in the Zed terminal and click the “Add to cart” button on the page. It does not work.
Configuring the MCP
On the GitHub page, we search for “OpenCode” with Ctrl+F and create the JSON file. The documentation suggests creating it globally, which makes sense to use it in multiple projects: ~/.config/opencode/opencode.json. For this practice, I created an opencode.json only for the project.
The documentation gives the code for npm, but in OpenCode I use it with pnpm:
Then we open OpenCode and verify that the MCP is loaded. There is usually a command or panel to see the connected MCP servers. If you type /mcps you can see the available MCPs.
Using it in Plan mode
With index.html running on Live Server, we write the prompt in Plan mode:
Use the chrome-devtools MCP and open http://127.0.0.1:5500/index.html, click the 'Add to cart' button and tell me why the cart does not work.
How it works
Why does a Chrome window open? The MCP launches a real Chrome instance (not headless by default) so it can interact with the actual page. That is why you see the window open with new_page.
About the snapshot, here is the important nuance: take_snapshot is not a screenshot. It is a snapshot of the accessibility/DOM tree of the page: a text representation of all the elements (buttons, text, inputs) with a unique id (uid) for each one. That is why it does not generate any image file.
Look at the sequence:
take_snapshotgets the list of elements, including the button withuid=1_4.click [uid=1_4]uses that exact identifier to click, without x/y coordinates and without “looking” at an image.
This is what the repository calls “reliable automation”: instead of the AI trying to guess where a button is in a screenshot (fragile and imprecise), it interacts directly with the real DOM structure. If you want a literal image, there is a different tool: take_screenshot.
The rest of the sequence, in short:
evaluate_scriptreads the real HTML/JS of the page to locate the typo in the code.list_console_messagesconfirms the error exactly as the browser throws it (aReferenceError), not a guess.
This contrast between take_snapshot and take_screenshot shows why this tool is more reliable than an agent that only “looks” at screenshots.
Fixing the error in Build mode
Now we write the prompt in Build mode:
Yes, fix it and test the button again to confirm that the cart updates.
And you can see how it checks the final results by testing the button again.
Conclusion
That is the key difference: it does not just tell you what is wrong, it really verifies it, opening the browser, clicking, and reading the console. Chrome DevTools MCP turns your AI into someone who debugs the way you would, not someone who guesses the code.
Video
In the following video you can see the complete process (Spanish audio).